.png)
What I'm Watching: A Record on One Engine, and a 10-Year That Only Paused

What I'm Watching · October 7, 2026
The S&P closed at a fresh record on Tuesday, 7,818.93. If you only read the headline, it looked like a clean, broad risk-on day. It wasn't. One sector did most of the work, small caps slipped again, and the bond market didn't confirm anything either way. These are the three charts from this week's Chart Room I'm keeping on my screen into today's FOMC Minutes at 2:00 PM ET.
Five Indexes, One Record
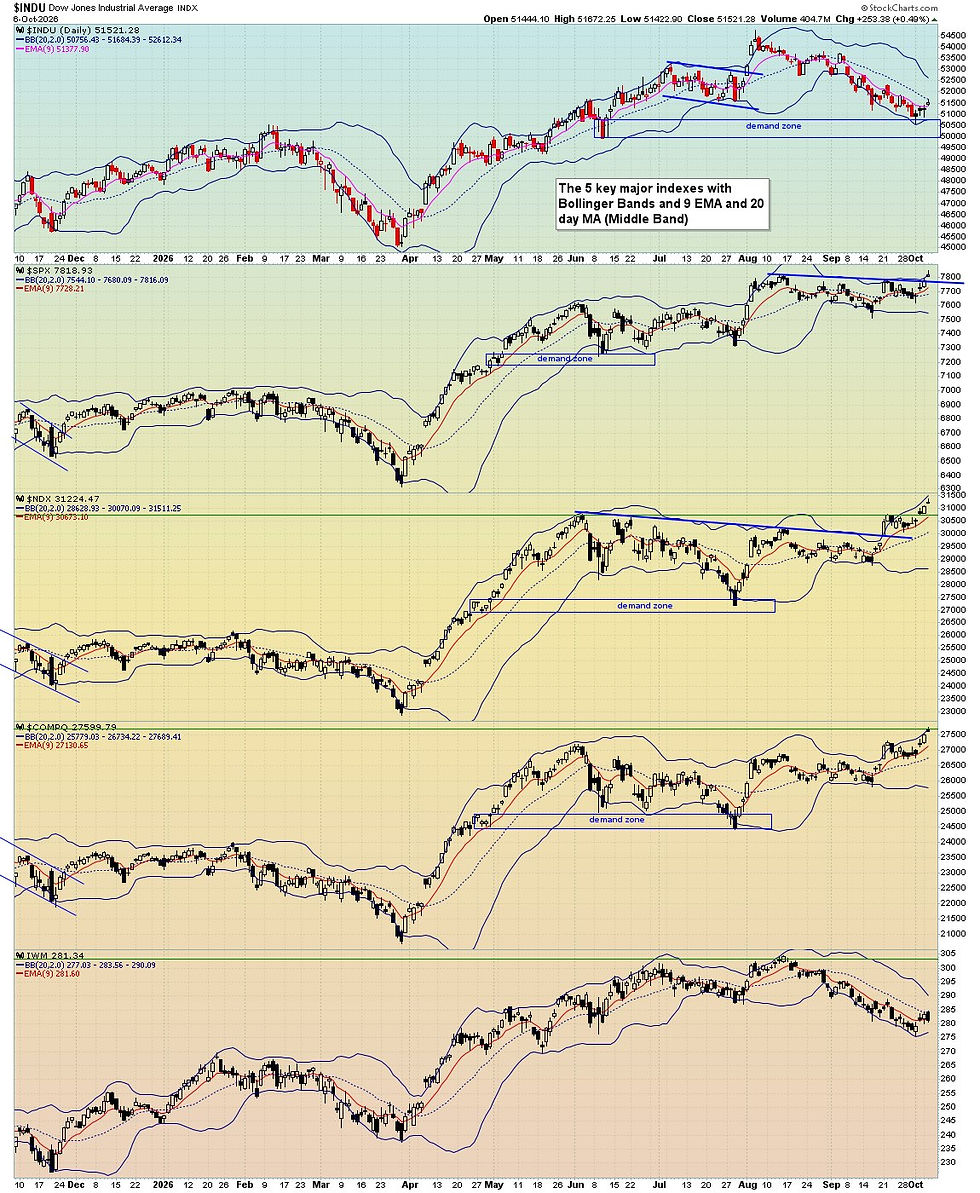
The Dow finished at 51,521.28, up 0.49%. The S&P 500 gained 0.58% to that new closing record, and the Nasdaq 100 added 0.5% to 31,224.47. Four of the five major indexes closed green. The one that didn't keep up was the one that matters most for breadth: the Russell 2000 sat at 281.34 after another soft session.
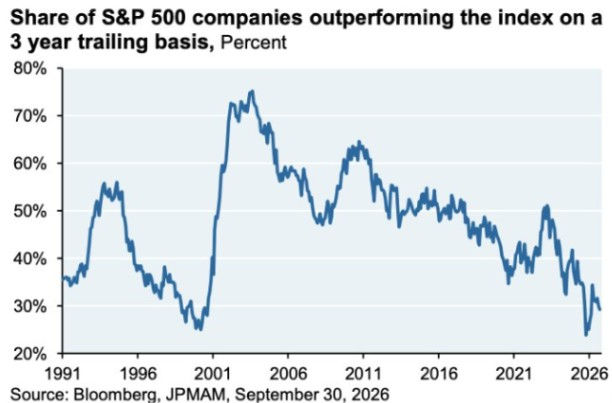
That's the whole picture in one chart. Large caps are grinding to new highs while the rest of the market shrugs. A market that only goes up on its biggest names is a market that's easy to spook.
Hans's take: Record headline, narrow engine. Watch the Russell, not the S&P, for the real signal.
Utilities: One Deal, One Massive Candle

Utilities led the board, up nearly 3% on a single headline: Alphabet and Constellation Energy agreed on a deal to power AI data centers with nuclear generation. On the weekly chart, XLU broke cleanly out of its multi-week 39 to 41 zone on heavy volume.
I like the structure. This fund has been making higher lows since the 2024 bottom. But this is one trade getting marked up and dragging an index-weighted tile with it, not a broad rotation. The bottom half of the board, communication services, health care, materials and staples, was flat to down.
Hans's take: A real breakout, triggered by a single trade. Give it a few sessions to hold as support before trusting it.
The 10-Year Paused. It Didn't Reverse.

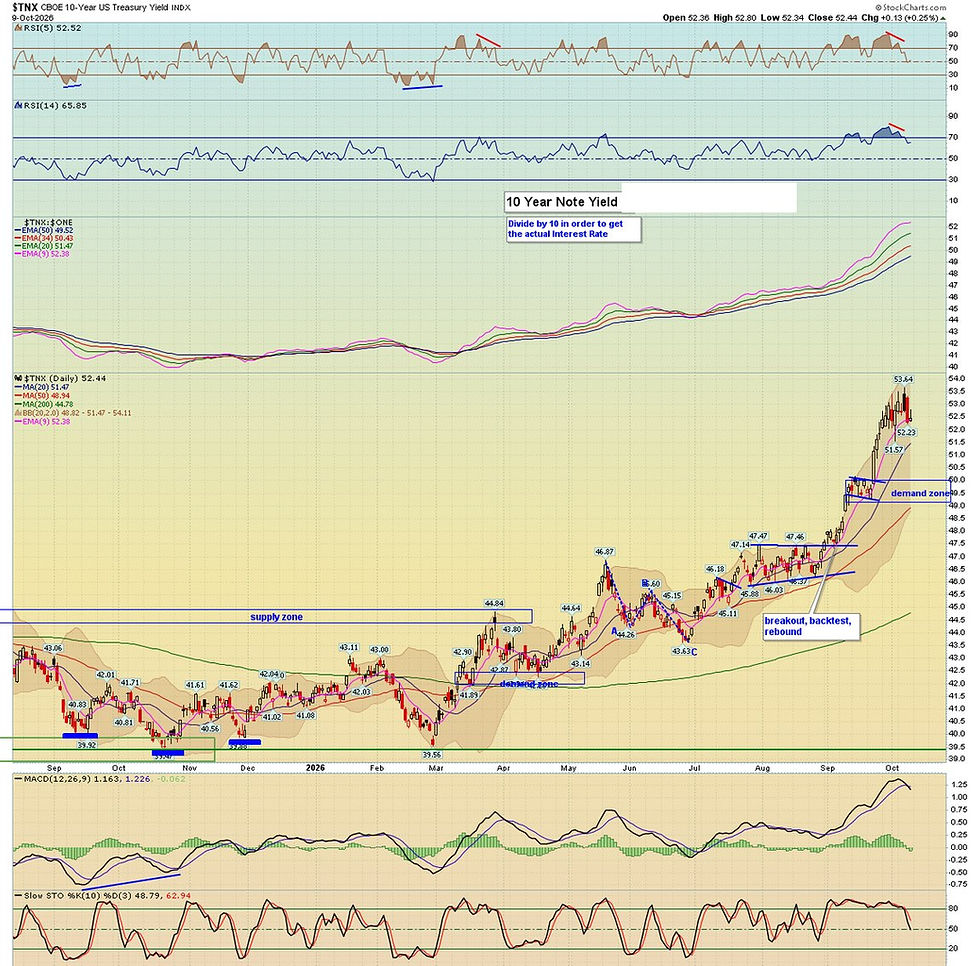
TNX closed at 52.69, which is about 5.27% on the actual yield, down four tenths of a point after touching 53.03 intraday. Yields cleared a multi-month supply zone back in August and have spent the last few weeks doing exactly what a healthy breakout does: backtest the old ceiling, hold it as support, and grind higher.
This is still the chart that decides whether the next move is a relief rally or another leg up in rates. I'm not fighting the trend until it breaks the demand zone sitting just under 50.
Hans's take: A pause at support, not a breakdown. The bond market still runs this show, and today's Minutes are its next chance to show its hand.
None of these three charts is a reason to get defensive today. All three are reasons to keep asking the question instead of assuming a record close answered it.
Trade smart, stay hedged. — Hans
This material is for educational and informational purposes only and is not investment advice or a recommendation to buy or sell any security. Options involve risk and are not suitable for all investors. Past performance does not guarantee future results.
Comments