.png)
What I'm Watching: Yields Flashing a Top, Breadth Still Broken, and Banks on Deck

What I'm Watching · October 13, 2026
Sunday's Chart Room was all about the phone companies, and for good reason. But three of the other charts in that letter matter more for the week we're in right now: the 10-year, the share of stocks above their 200-day, and the banks, which kicked off earnings season this morning. Here's what I'm watching on each.
The Top in Yields Got Its First Confirmation
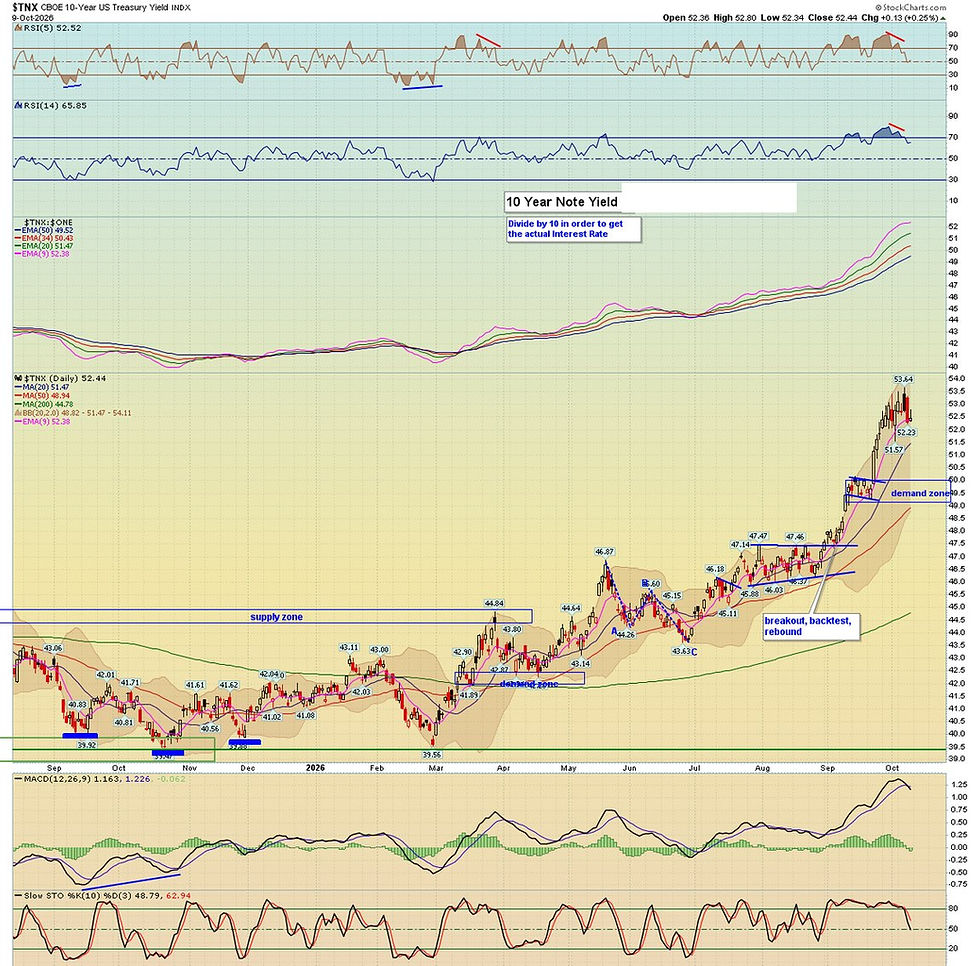
Last Wednesday the 10-year ran to 5.36% ($TNX 53.64), its highest yield since 2002, and got rejected the same day. I called that a possible top in progress, with two confirmations still missing. One of them showed up last week: the MACD crossed below its signal line. $TNX finished Friday at 52.44 (5.24%), RSI slipped back under 70, and both RSI panes are showing negative divergences.
The confirmation that matters for price is still missing. I need a close back under 51.57. Last week's low was 52.23. Until 51.57 breaks, this is a pause at a 24-year high, not a reversal, and Wednesday's CPI report is the obvious test.
Hans's take: Momentum is rolling over; price hasn't broken yet. A close under 51.57 is what turns “possible top” into “top.”
Half the Market Is Still Below Its 200-Day
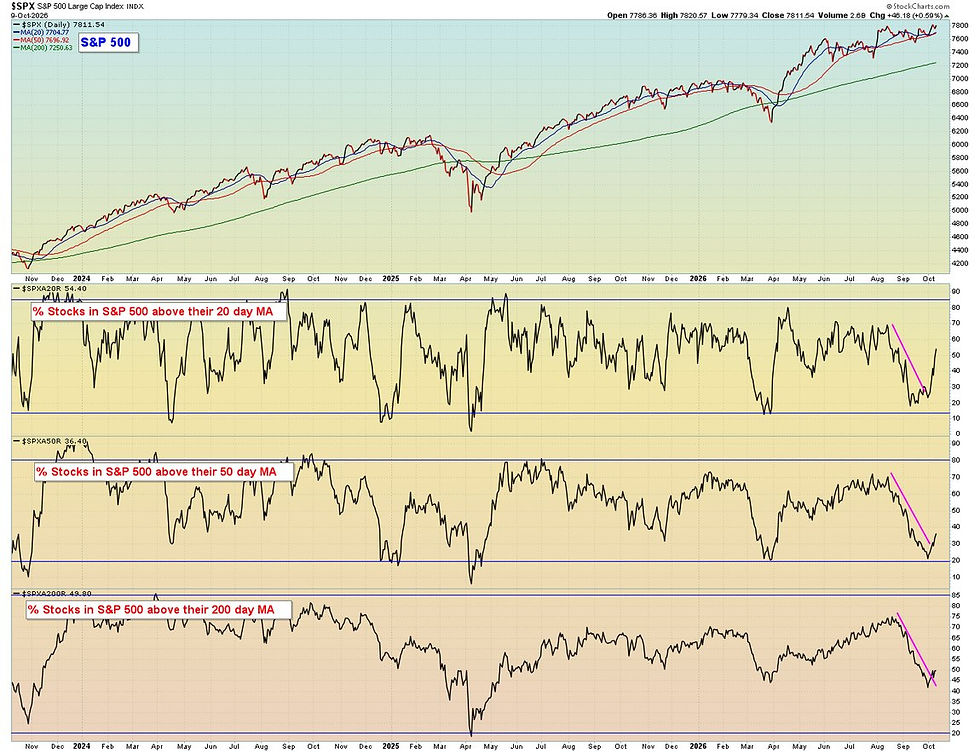
Three readings tell you where the average S&P 500 stock really stands. 54.4% are above their 20-day moving average, up from under 20% in mid-September, so the short-term bounce is real. Only 36.4% are above their 50-day. And 49.8% are above their 200-day, which means about half the index is still in a long-term downtrend while the S&P itself sits a few points from a record.
The detail that stuck with me: at the low two weeks ago, the 200-day reading fell to about 42%, lower than it went at the bottom of the spring correction. All three lines have turned up, which is the good news. The repair just isn't finished.
Hans's take: The bounce is real; the repair isn't done. I want the 200-day reading back above 50% and holding before I call this a healthy market again.
The Banks Report This Week. The Chart Is Ready.
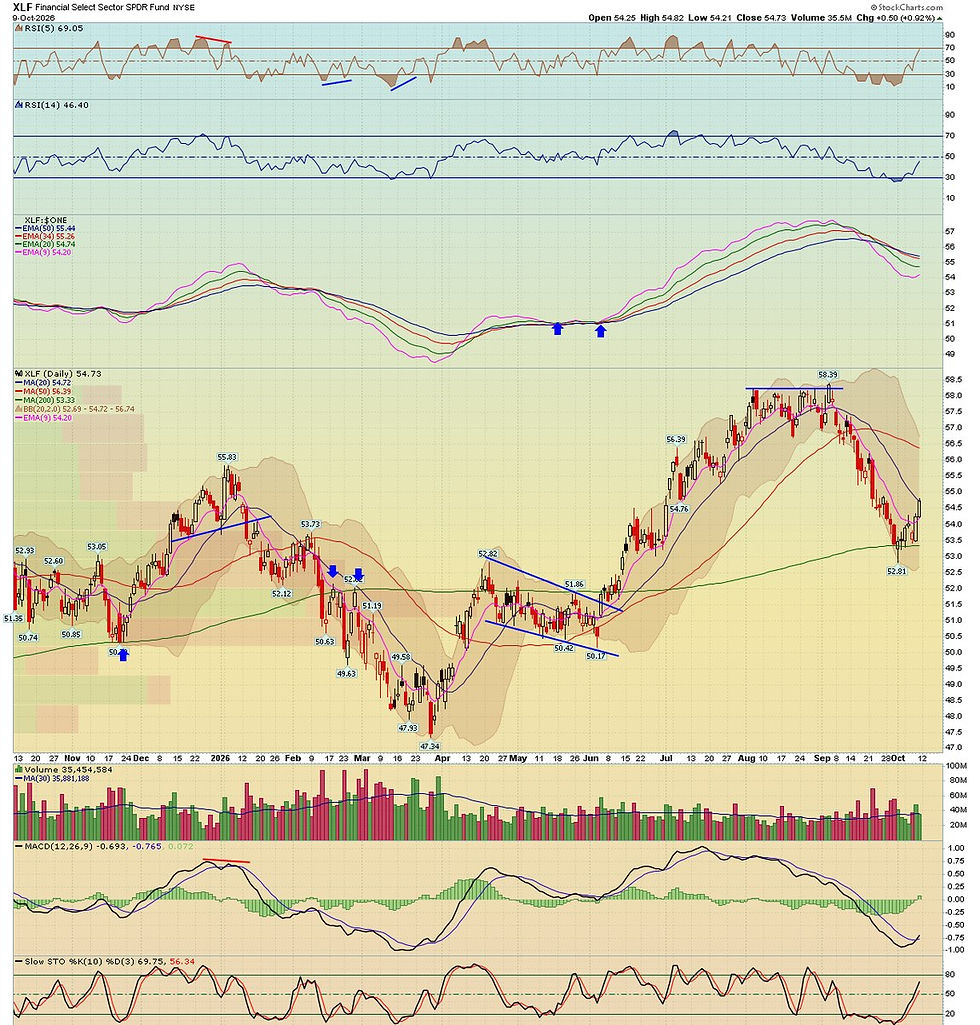
XLF gained 2.32% last week to 54.73. It bounced off the 52.81 low and its 200-day (53.33), closed right on its 20-day (54.72), and the MACD just crossed back above its signal line. That's about as clean a setup as you get heading into earnings.
JPMorgan, Wells Fargo, Citi and Goldman were up first this morning, and Bank of America, Morgan Stanley and BlackRock follow Wednesday. Options were pricing moves of 3.6% to 5.1% for the group. The number I care about is deposit costs. With the 10-year above 5%, money sitting in low-rate accounts has every reason to move, and that's where the yield chart and the bank chart meet.
Hans's take: Held the 200-day, reclaimed the 20-day, MACD turning up. Now the earnings have to back it up.
Tie the three together and it's really one story. Yields are trying to top, and Wednesday's CPI decides whether that sticks. If it does, the breadth repair has room to finish. If it doesn't, the market has to digest higher rates on top of a heavy earnings week. Options are pricing a fairly quiet week with the VIX under 15, which makes protection cheap. I'd rather own it and not need it.
Want all 20 charts? Read the full weekend Chart Room here.
Trade smart, stay hedged. — Hans
This material is for educational and informational purposes only and is not investment advice or a recommendation to buy or sell any security. Options involve risk and are not suitable for all investors. Past performance does not guarantee future results.

Comments