.png)
The Chart Room: It’s Not Your Imagination

OPTIONS WITH HANS · CHART ROOM
It’s Not Your Imagination. Seven in Ten Stocks Are Losing to the Index.
Tuesday, October 13, 2026 · Charts through today's close
Yes, This Is Tough. This Chart Says It All.
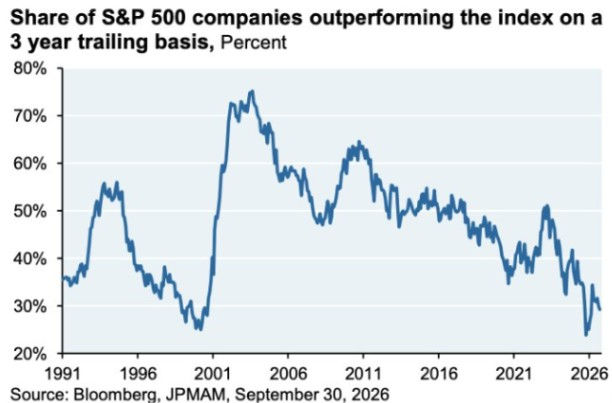
Chart: J.P. Morgan Asset Management, using Bloomberg data through September 30, 2026.
Yes, this market is tough. It’s not your imagination, and this chart says it all. It shows the share of S&P 500 companies that have beaten the index over the trailing three years. The latest reading is about 29%. Flip that around and roughly seven out of ten companies in the S&P have lagged the S&P since the fall of 2023.
That’s near the lowest reading in 35 years of data. It bottomed around 24% last year, below even the dot-com peak in 2000 (about 25%). Compare that with 2003, when about three-quarters of the index was beating it, or 2010, when close to two-thirds were.
So if you’ve been doing your homework and your stocks still trail the index, you have plenty of company. A handful of giants have been carrying the S&P, and the average stock hasn’t kept up. The last time this chart got this lopsided, in 2000, it swung hard the other way over the next three years. But that happened mostly because the big names fell hard, not because everything else took off.
Hans’s take: Most of the S&P can’t keep up with the S&P. So don’t grade yourself against the index. Be picky, keep your size sensible, and let the charts below do the sorting.
You’re reading the free Chart Room: five of today’s sixteen charts. If this market has been a grind, you don’t have to trade it alone. Hans trades it live, all day, inside Trader63, and members get the full Chart Room every issue.
Note From Hans
Flat on the surface again. The S&P closed at 7,805.45, down 1.79 points, after spending the whole day inside a 28-point range. It’s been boxed in between roughly 7,730 and 7,845 for a week now, and there’s a big pile of options positioning around 7,800 heading into Friday’s monthly expiration. That keeps pinning it.
Underneath that flat line, a lot happened. Bank earnings kicked off, and the market didn’t like what it saw. Citi beat estimates and still fell 5.6%. JPMorgan missed, ran up 3% anyway, then gave it all back and closed down 0.9%. Johnson & Johnson dropped about 6% after its report, a big reason health care was the worst sector on the board. Memory chips got hit after China’s CXMT claimed a denser DRAM design, news that sent Korea’s KOSPI sharply lower overnight, and Micron fell 3.6%. On the other side, energy led and Meta jumped 2.6%.
That’s the chart at the top playing out in a single session: big moves in individual names, an index that barely budged. You could have been right about the market today and still lost money on the stock.
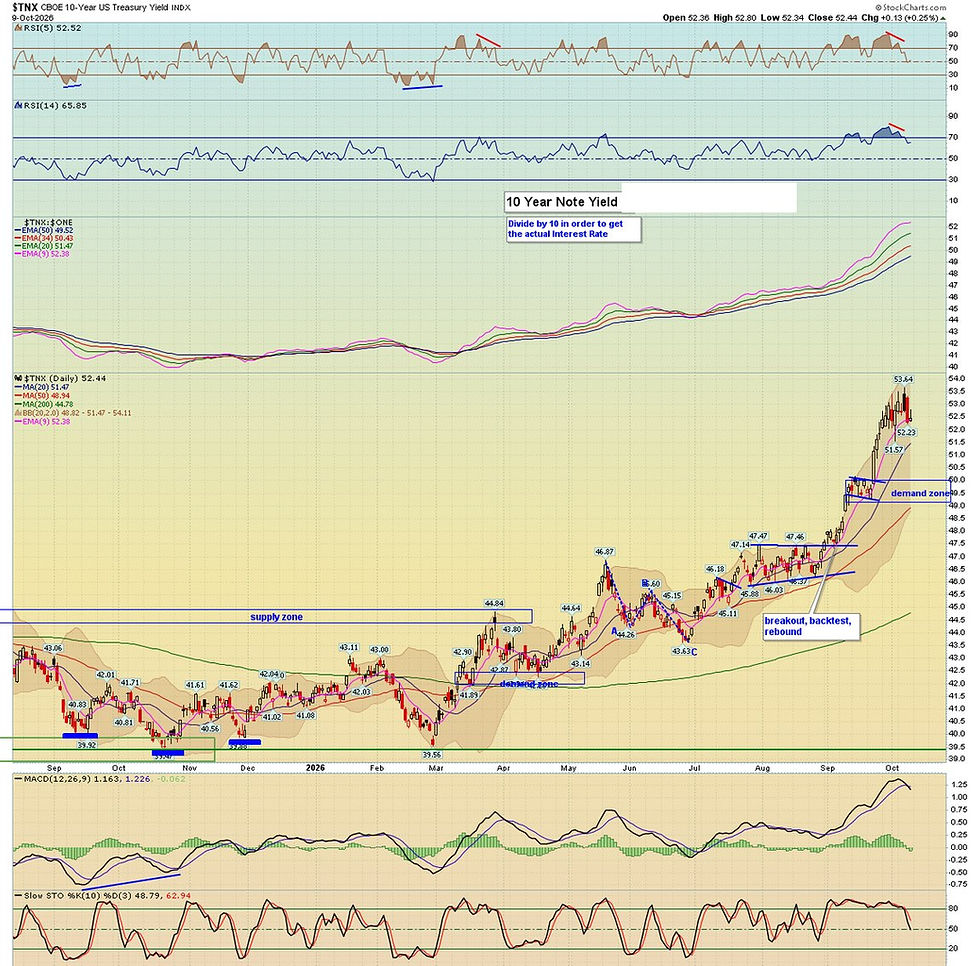
Tomorrow is the one that matters for the index: September CPI at 8:30 AM. The consensus is 0.6% on the headline (3.6% year over year) and 0.2% on the core (2.5% year over year). Options are pricing about a 0.6% move in the S&P for the day. With the 10-year still above 5.2%, a hot number lands right on the bond market, and that’s where the risk is.
The Board
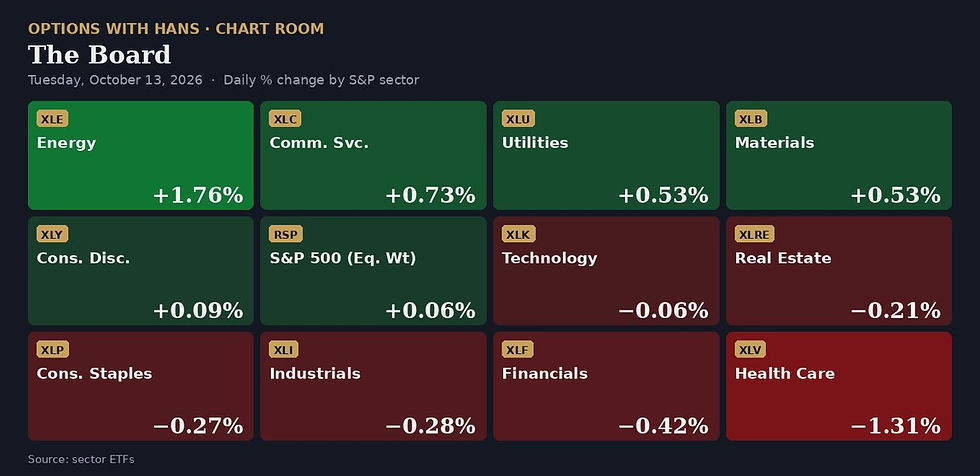
Six green tiles, six red. Energy led (+1.76%) with crude pushing back toward $95, and communication services (+0.73%) got help from Meta. Utilities and materials both added 0.53%. At the bottom: health care (−1.31%), dragged down by J&J, and financials (−0.42%) on the bank reports. The equal-weight S&P (+0.06%) actually edged out the cap-weighted index (−0.02%) today. It just didn’t feel that way if you owned a bank or a drug stock.
Junk Bonds Aren’t Buying the Record

Top panel is the S&P 500. Bottom panel is HYG, the big high-yield corporate bond ETF. Most of the time these two move together, and when they split, it usually means something.
Right now they’ve split. The S&P is half a percent from its record. HYG peaked near 79 in late August, fell to about 76.4 by the start of October, and has only bounced to 77.09. It’s still below its 200-day moving average (77.90). Into October the S&P made higher lows while HYG made a much lower one. Credit isn’t confirming the index.
Hans’s take: Credit doesn’t have to crash for me to get careful. It just has to stop confirming. I want HYG back above its 200-day near 77.90. Until then, the S&P’s record gets an asterisk.
Beat Estimates. Fell 5.6%.
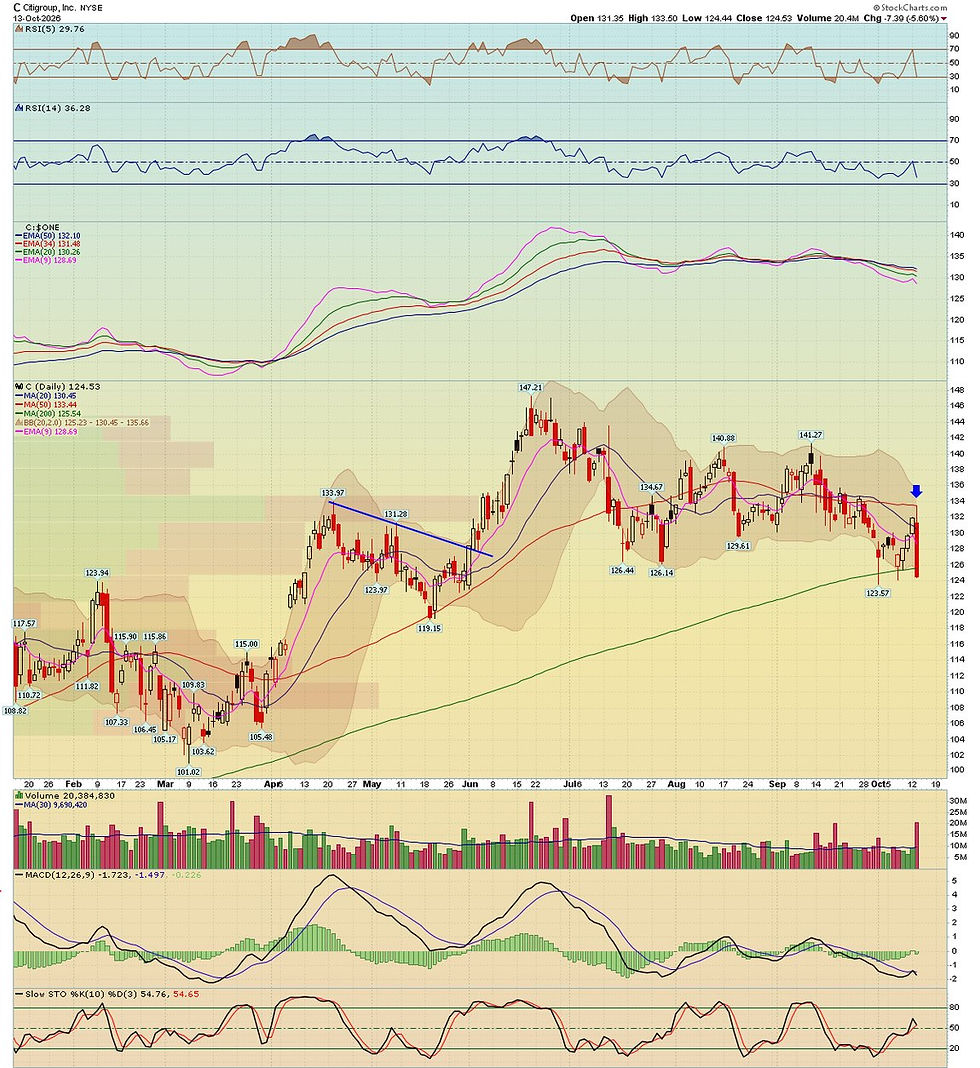
Citi earned $2.85 a share against estimates around $2.65 and beat on revenue too. The stock still fell 5.6% to 124.53 on 20.4 million shares, about double its 30-day average volume. That’s not a shrug. That’s selling.
The chart shows exactly where it turned. The high of the day, 133.50, tagged the 50-day moving average (133.44) almost to the penny before sellers took over, and it closed near the low, under the 200-day (125.54), a line it had held since the spring. The early-October low at 123.57 is right underneath. Below that, the May low near 119 is the next stop.
Hans’s take: A beat that sells off on double volume tells you the good news was already in the price. I’d want to see 123.57 hold before getting interested.
McDonald’s: Down 30% From the High
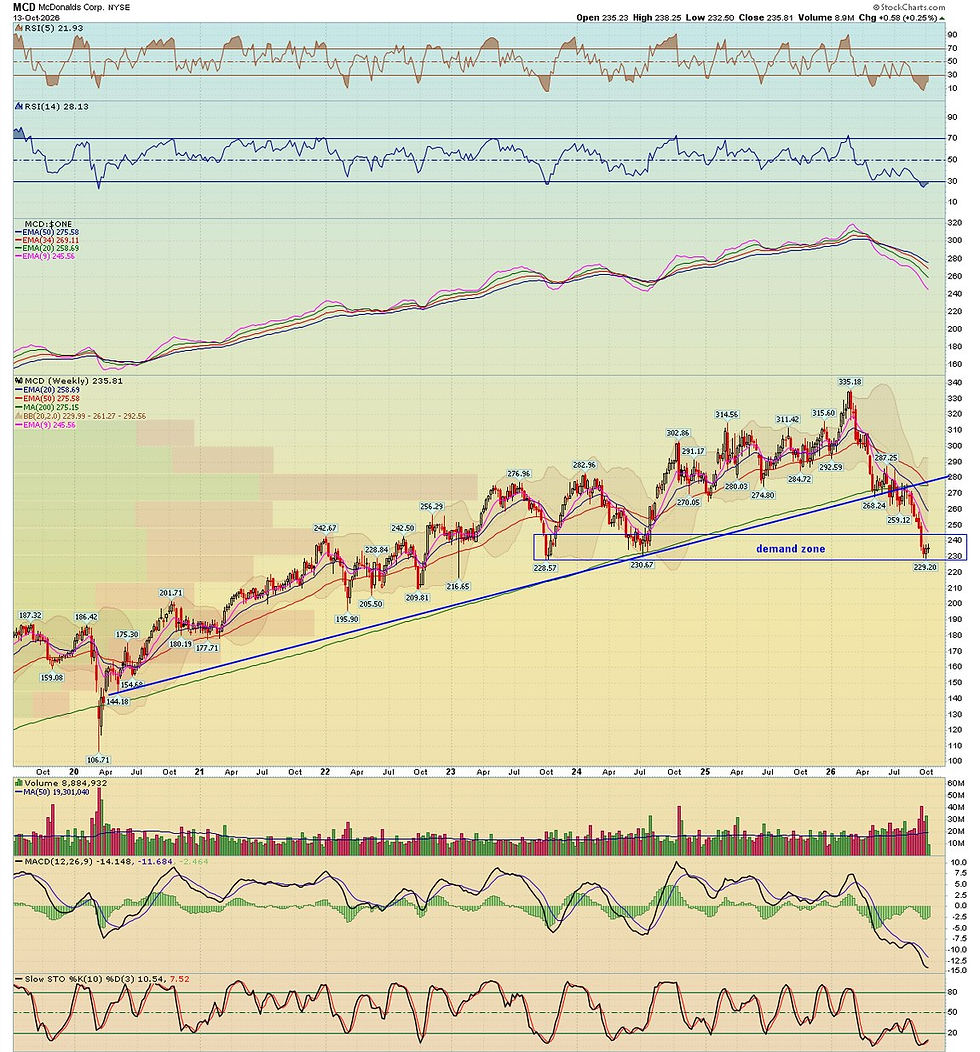
Here’s what the chart at the top looks like up close. This is McDonald’s on a weekly chart. It peaked at 335.18 early this year and has dropped as low as 229.20, a 31.6% slide, while the S&P kept making records. It closed today at 235.81.
Along the way it broke the uptrend line that ran all the way from the 2020 lows and lost its 200-week moving average (275.15). Now it’s sitting in the demand zone built by the October 2023 and July 2024 lows (228.57 and 230.67). Weekly RSI is down to 28, and both stochastics are pinned near the floor.
Hans’s take: This is a demand zone, not a buy signal. If it holds, a bounce back toward the broken trendline and the 200-week average, up around 275, would be a normal retest. If 228 breaks, the 210 to 217 area from 2022 and 2023 is next.
Micron Gapped Through the Wedge, Then Closed at the High

Micron opened at 934.07, under the bottom of the rising wedge it’s been riding since July and below its 50-day moving average (981.98). The September high at 1,108.72 had already stalled just below the supply zone (roughly 1,115 to 1,170).
Then buyers showed up near the support box from the mid-September low (902.60). Micron closed at 953.19, down 3.62%, but right at its high of the day (953.60). That’s a decent recovery. It’s still below the wedge and below the 50-day, though.
Hans’s take: Closing at the high after a gap down is a good sign. But it broke the wedge and the 50-day in one shot. I’d let it get back over 982 before trusting the bounce.
Energy Just Broke Out to a New High
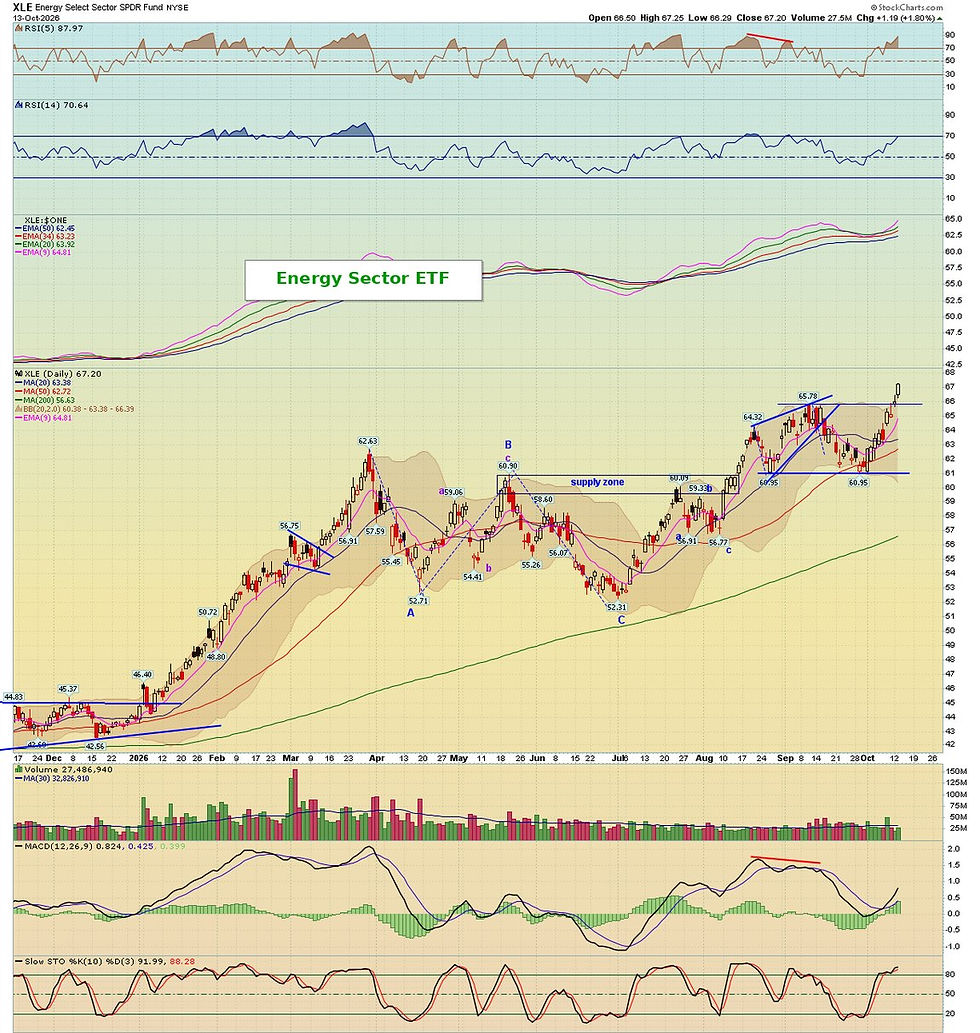
Energy was the best sector on the board, and XLE closed at 67.20, up 1.80%. That’s the highest close on this chart and a clean break above the September high at 65.78. Crude helped: WTI finished at $94.52, up 0.8%.
It spent August and September chopping between 60.95 and 65.78, double-bottomed at 60.95, and has now cleared the top of the range with the 20-day (63.38) and 50-day (62.72) underneath it. The 14-day RSI is at 70.6, so it’s a little stretched in the short run.
Hans’s take: Breakouts from a two-month range usually get backtested. A pullback toward 66 that holds would be the textbook spot. The range was about $4.80 tall, which points toward the 70 area over time.
Still in the full Chart Room: eleven more charts, including the bank index and JPMorgan, the McClellan breadth oscillator, Nike and Whirlpool, QQQ, Meta, the semiconductor ETF, the 10-year yield, the dollar and the gold miners, plus what’s on deck for CPI, PPI and Friday’s options expiration.
WANT TO TRADE THIS MARKET ALONGSIDE HANS?
Join Trader63 — $99.97/Month
A market where seven in ten stocks lag the index is exactly why Trader63 exists. When stock picking alone is this hard, the edge comes from being selective, managing risk and using options to get paid while you wait. That’s what Hans does in the room, live, all day.
Every trade he takes is posted as he takes it, with the reasoning behind it, plus his read on volatility and the research landing on his desk. That includes the Weekly Wheel program running in the room right now.
No courses and no weekly class to wait for. Just the room, his full portfolio, and the full Chart Room every issue, along with the MTI Alpha Momentum emails and the complete daily chart package.
Spots are capped.
Trade smart, stay hedged.
Hans
Charts are end-of-day through Tuesday, October 13, 2026 (crude, gold and the dollar through the evening print). Market data sourced from StockCharts. Lead chart: J.P. Morgan Asset Management, Bloomberg data through September 30, 2026.
This material is for educational and informational purposes only and is not a recommendation to buy or sell any security. Options carry risk and are not suitable for every investor.

Comments