.png)
What I'm Watching: A 24-Year High Rejected, 320 New Lows, and Micron Running Alone

What I'm Watching · October 11, 2026
Wednesday's Chart Room covered fifteen charts. The headline was simple: the 10-year ran to its highest yield since 2002, a strong Treasury auction knocked it back, and the S&P closed down just 0.22% at 7,801.77. Underneath that calm number, about three out of four S&P stocks closed lower. These are the three charts from that letter I'm still watching as we head into a week of bank earnings.
The 10-Year: Why 5.0% to 5.5% Is the Whole Ballgame

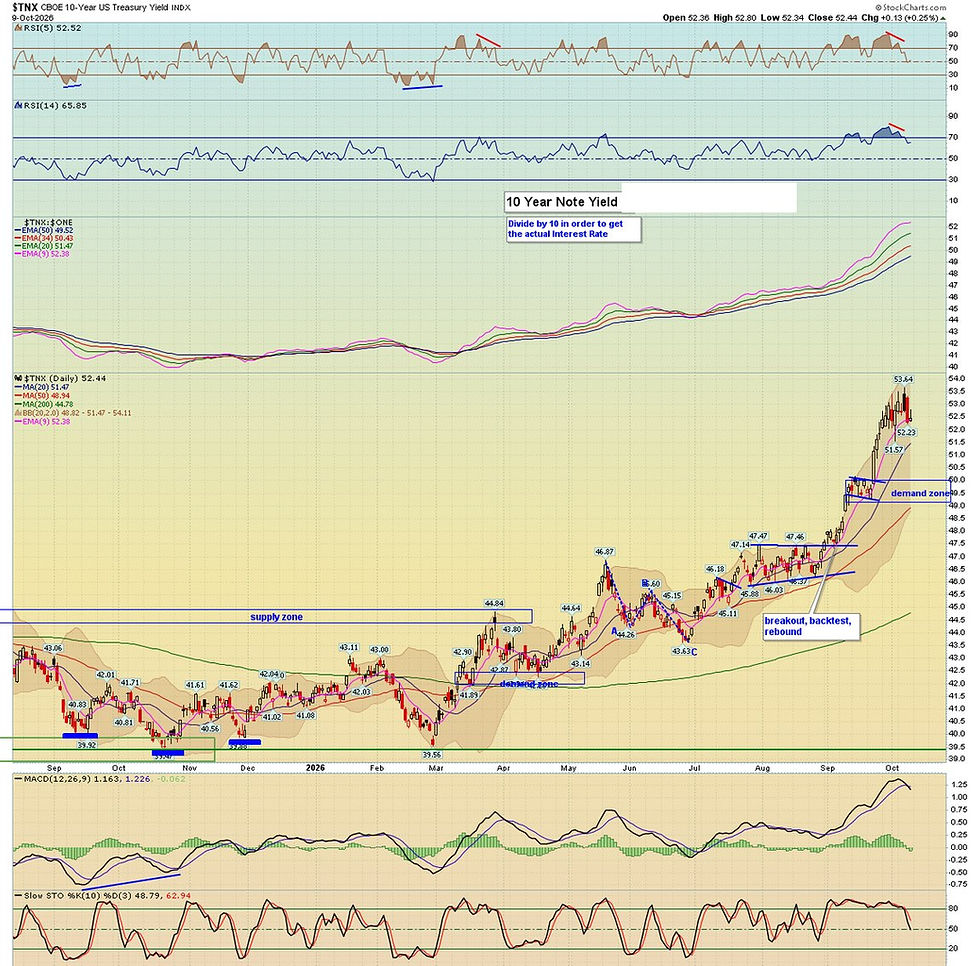
The 10-year topped in 1981 near 16%, spent the next 39 years falling, and broke its 35-year downtrend in 2022. Now it's pushing into the supply zone between roughly 5.0% and 5.5%, the same area that capped yields in 2002 and 2007. On Wednesday $TNX ran as high as 5.36% in the morning, then the $39 billion auction came in at 5.30% and yields backed off to close at 5.28%.
Look at what's above that zone. There is very little price history between 5.5% and the next supply area up around 6.5%. If 5.5% gives way on a closing basis, there isn't much on this chart to slow it down. That's why I care more about this zone than about any single Fed meeting. Real buyers showed up inside it on Wednesday, and that matters.
Hans's take: 5.0% to 5.5% is the line in the sand. Hold it and stocks can breathe. Lose it and the chart opens up toward 6.5%.
Under the Surface: 23 New Highs, 320 New Lows
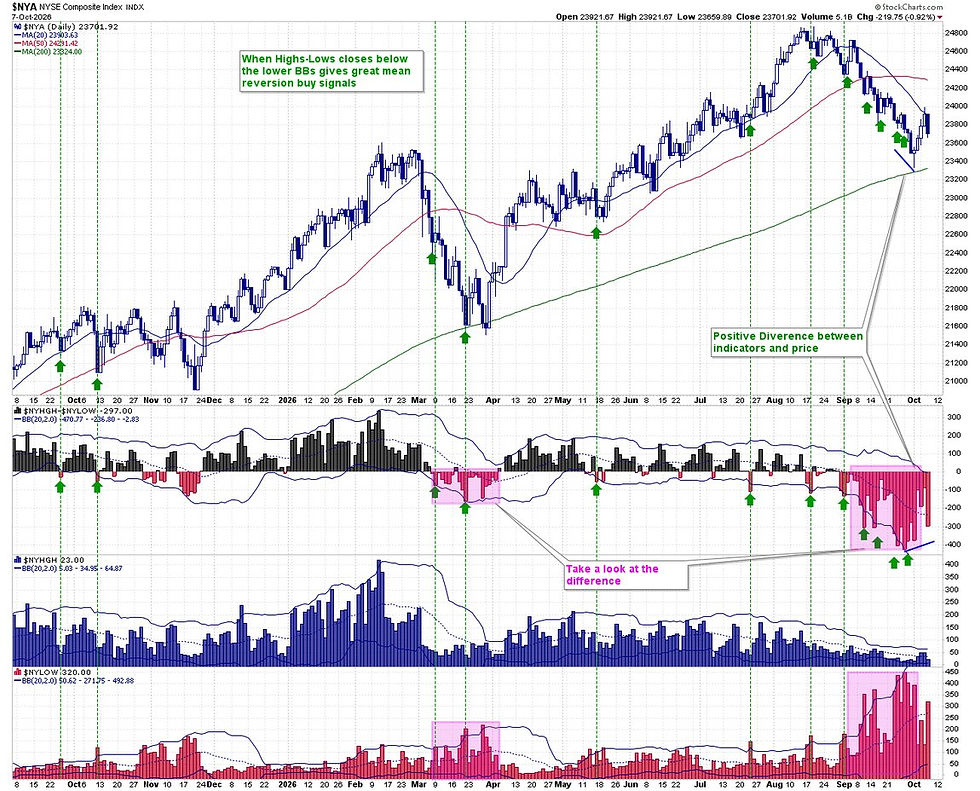
Here's the part the S&P hid. The NYSE printed 23 new highs and 320 new lows, a net reading of minus 297, after minus 82 the day before. The NYSE Composite fell 0.92%, about four times the S&P's loss, and the Nasdaq has now had more new lows than new highs for 28 straight sessions.
One caveat in the bulls' favor. This indicator throws its best mean-reversion buy signals when it closes below its lower Bollinger Band, which sits around minus 470 right now. Minus 297 isn't there. That's deterioration, not capitulation, and capitulation is usually the better entry.
Hans's take: The index fell 0.2%. The average NYSE stock had a much worse day. Deterioration, not capitulation.
Micron Ripped on a Red Day
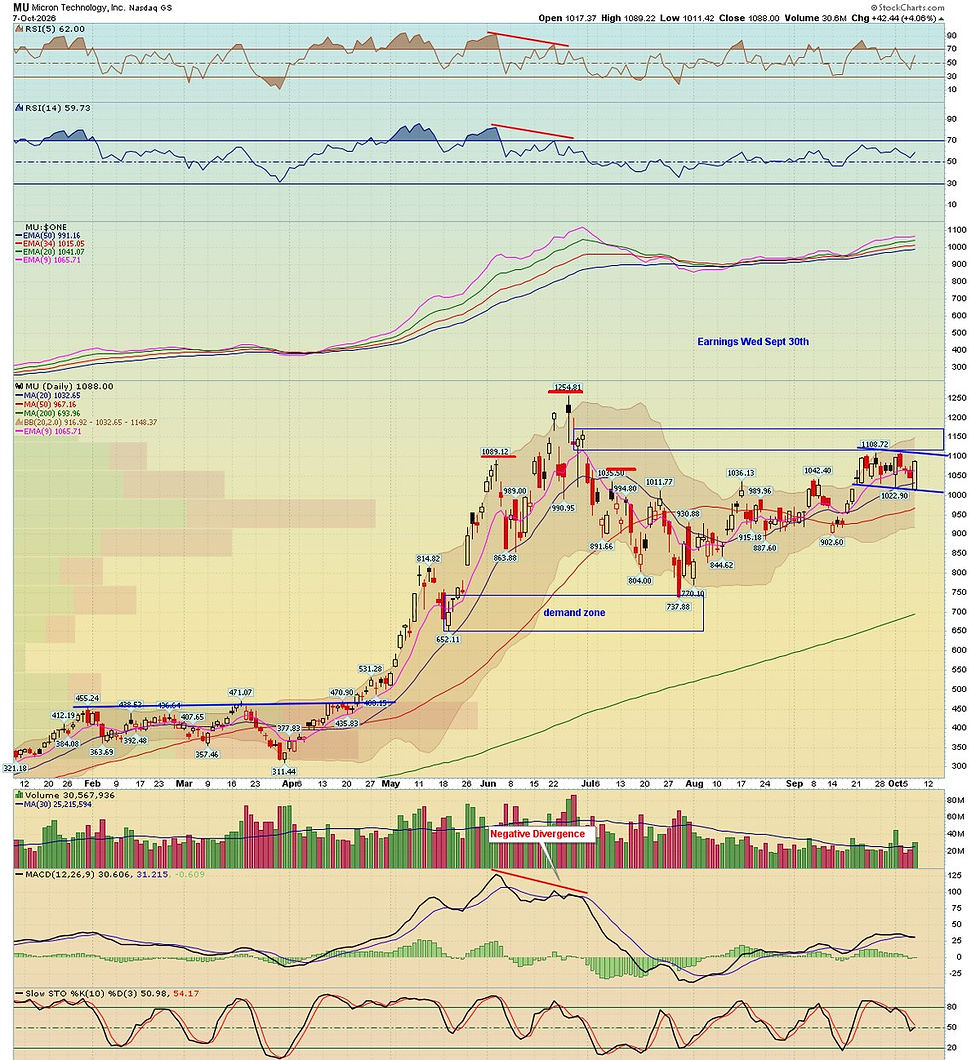
Micron rallied 4.06% to 1,088 on a day when most of the market went the other way, closing right at its high on a fresh Street price-target hike. Look at where it happened. The stock has spent two weeks coiling in a tight flag between roughly 1,005 and 1,100, just under the 1,110 to 1,170 supply zone left over from the summer.
This is the memory-bottleneck trade I've been banging the drum on for months, and on Wednesday it acted like a leader. A close above 1,110 would put the summer high of 1,254.81 back in play. Until then it's a coil under supply, and supply is where breakouts get tested.
Hans's take: Leadership on a red day from the name closest to the bottleneck. 1,110 is the trigger; the 1,011 low is the line.
Put the three together and you get a pinned index, a bond market holding the remote, and a lot of churn underneath. That's not a reason to get defensive. It is a reason to be picky, and relative strength on a red day, like Micron, is information.
Trade smart, stay hedged. — Hans
This material is for educational and informational purposes only and is not investment advice or a recommendation to buy or sell any security. Options involve risk and are not suitable for all investors. Past performance does not guarantee future results.
Comments